
Sustainability/ Reports/ Dashboard
Dashboard & Data Overview
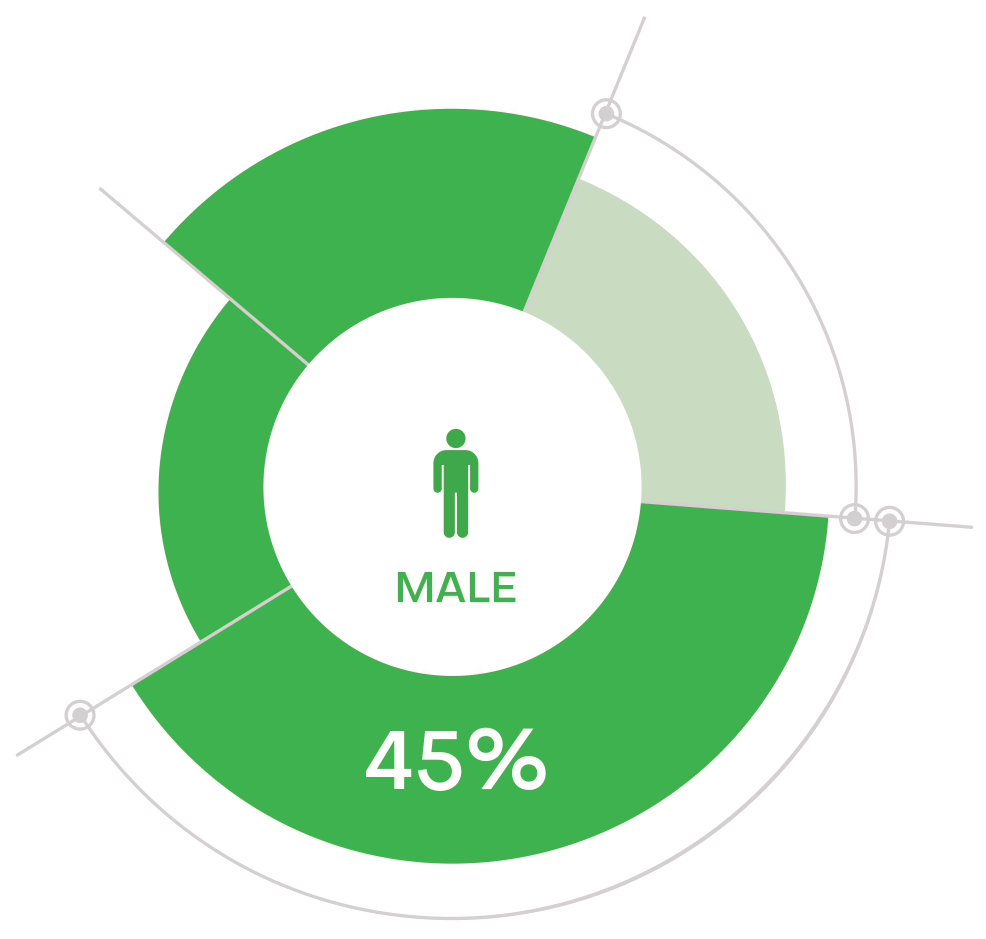
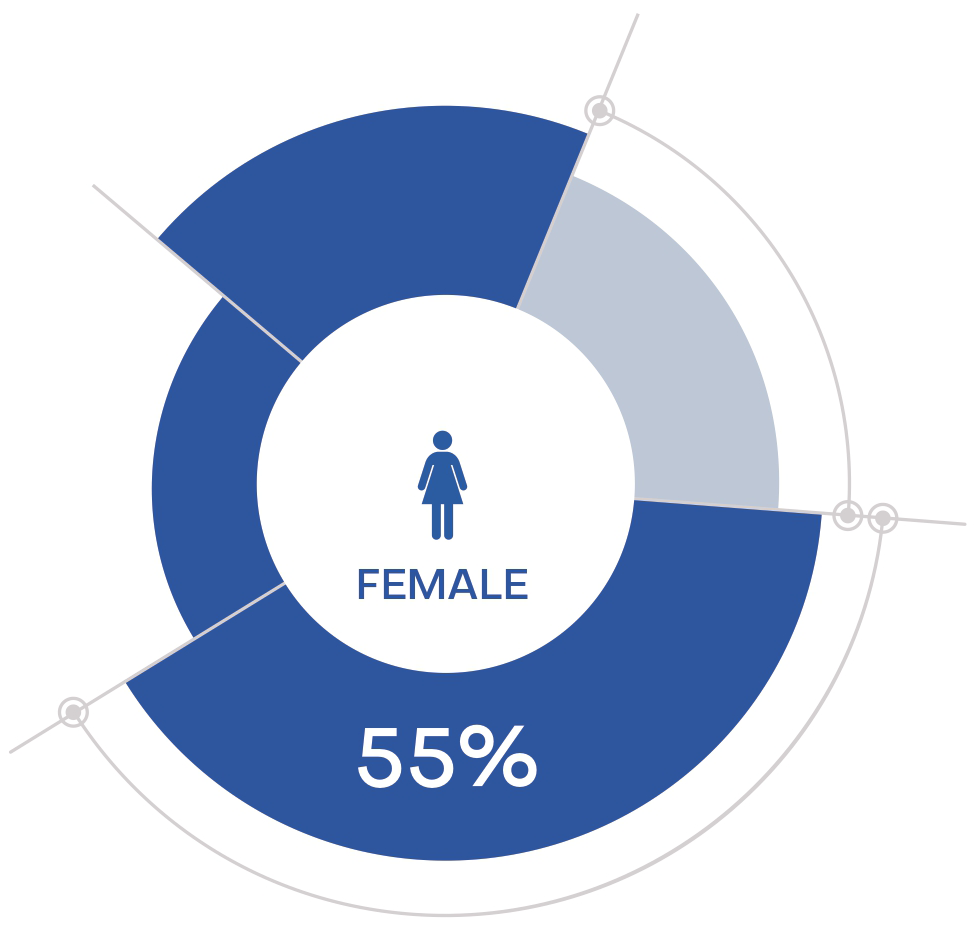
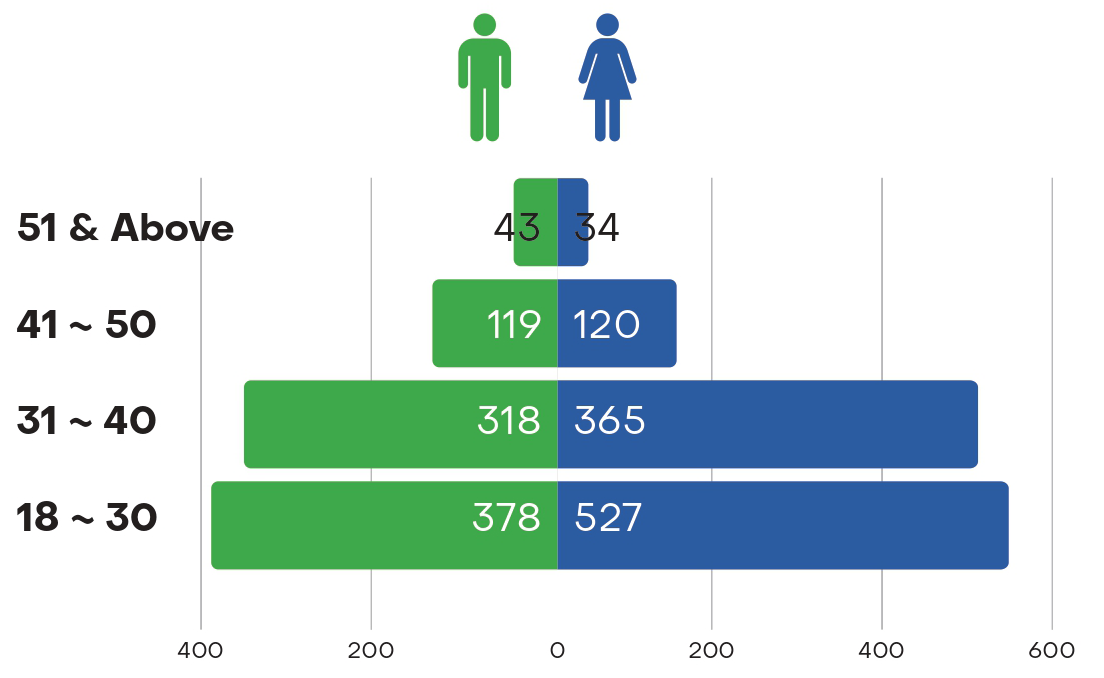
OUR PEOPLES PROFILE
Gender Equity
Age Distribution By Gender
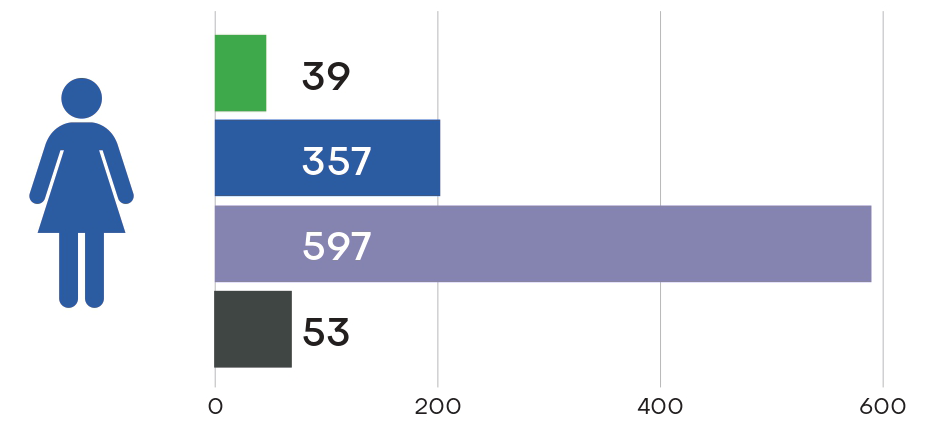
Gender Balance By Job Type
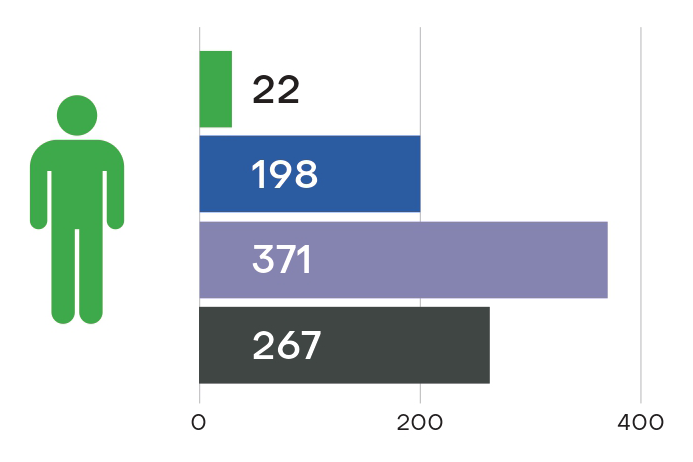


*As at 31st March 2023
83% of the workforce were aged 40 years and below, indicating a relatively young workforce and this
provides opportunities to the Bank to build its future workforce today.
Data Overview
| People | |||||
|---|---|---|---|---|---|
| Area Covered | Unit | Financial year ending 30th Sept 2020 | Financial year ending 30th Sept 2021 | Financial year ending 31st March 2022 (6 months) |
Financial year ending 31st March 2023 |
| Headcount | Number | 1,835 | 1,721 | 1,756 | 1904 |
| Number of female employees | Number | 964 | 889 | 921 | 1046 |
| Number of male employees | Number | 871 | 833 | 835 | 858 |
| Female:Male ratio | Ratio | 53:47 | 52:48 | 52:48 | 55:45 |
| Number of employees between 18-30 | Number | 846 | 731 | 746 | 905 |
| Number of employees between 31-40 | Number | 657 | 670 | 698 | 683 |
| Number of employees between 41-50 | Number | 259 | 246 | 235 | 239 |
| Number of employees above 51 | Number | 73 | 74 | 77 | 77 |
| 18-30 years old (% of the total number of employees) | Percentage | 46% | 42% | 42% | 47% |
| 31-40 years old (% of the total number of employees) | Percentage | 36% | 39% | 40% | 36% |
| 41-50 years old (% of the total number of employees) | Percentage | 14% | 14% | 13% | 13% |
| Percentage of 51 years old and above in the total number of employees | Percentage | 4% | 4% | 4% | 4% |
| Number of female employees in Senior Management positions | Number | 17 | 15 | 14 | 17 |
| Number of male employees in Senior Management positions | Number | 15 | 11 | 11 | 12 |
| Number of employees trained | Number | 1,800 | 1,722 | 1,756 | 1,904 |
| Number of training hours | Man hours | 13,157 | 22,176 | 35,774 | 60596 |
| Number of people promoted | Number | 312 | 220 | 192 | 195 |
| Number of female employees promoted | Number | 213 | 132 | 118 | 135 |
| Number of male employees promoted | Number | 99 | 88 | 74 | 60 |
| Number of employees transferred for upskilling | Number | 359 | 400 | 223 | 343 |
| Turnover rate (All Staff) | Percentage | 13% | 17% | 19.7% | 23.6% |
| Turnover rate of Operational staff (exclude Driver, Cleaner, Security) |
Percentage | 10.9% | 13.4% | 15.8% | 14.8% |
| Absenteeism rate | Percentage | 0.23% | 0.23% | 0.29% | 0.26% |
| Number of people with disability | Number | 1 | 1 | 1 | 0 |
| Number of accidents | Number | 20 | 7 | 6 | 15 |
| Fatality rate | Percentage | Nil | Nil | Nil | Nil |
| LTI Frequency rate (LTIFR) | LTI per million manhours | 2.68 | 2.27 | 3.71 | 4.15 |
| Society | |||||
|---|---|---|---|---|---|
| Area Covered | Unit | Financial year ending 30th Sept 2020 | Financial year ending 30th Sept 2021 | Financial year ending 31st March 2022 (6 months) |
Financial year ending 31st March 2023 |
| Donations | MMK | 170.3 million | 124.2 million | 91.9 million | 434.4 million |
| Tax | MMK | 4.5 billion | 4.9 billion | 3.2 billion | 5.4 billion |
| Number of philanthropic causes supported | Number | 7 | 5 | 4 | 9 |
| Number of cases of disciplinary actions taken from complaints and infringement of the Code of Ethics and other Bank Policies | Number | 43 | 8 | 11 | 33 |
| Environment | |||||
|---|---|---|---|---|---|
| Area Covered | Unit | Financial year ending 30th Sept 2020 | Financial year ending 30th Sept 2021 | Financial year ending 31st March 2022 (6 months) |
Financial year ending 31st March 2023 |
| Water | MMK | 4.2 million | 2 million | 1.6 million | 5 million |
| Paper | MMK | 42 million | 23 million | 7 million | 36 million |
| Electricity energy | MMK | 343.6 million | 290.6 million | 144 million | 323 million |
| Petrol energy | MMK | 183.8 million | 193.8 million | 257.7 million | 1022 million |
| Carbon | metric tons | 1,880 | 1,266 | 754 | 1636 |